

 email: marie@sb-roscoff.fr

Figure 1: Typical right-angle light scatter (RALS) vs. red fluorescence plot of an unstained, live culture
of the oceanic photosynthetic prokaryote Prochlorococcus sp. (Proc) clone MED4 (size = 0.6 um). Fluorescent
microspheres (0.95 um beads) were added to the samples to calibrate the system.

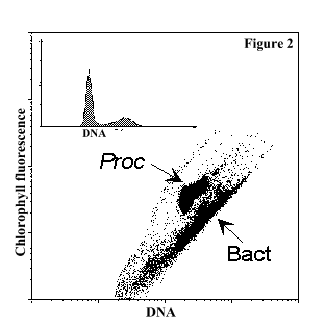
Figure 2: DNA fluorescence (green) vs. chlorophyll fluorescence (red) plot of a culture of the oceanic photosynthetic prokaryote
Prochlorococcus sp. (Proc) clone MED4 after fixing with 0.1% glutaraldehyde and staining with the DNA-specific dye
SYBR Green I (Molecular Probes, Inc.). Determining DNA distribution in Prochlorococcus cells
(Proc) and enumerating contaminant bacteria (Bact) was possible with this stain. The insert shows the DNA distribution of the Prochlorococcus population on a linear scale.

Figure 3: Right-angle light scatter (RALS) vs. red fluorescence plot of an unstained, live sample of phytoplankton taken at 95 m in the Equatorial Pacific. This dot plot shows the distribution of Prochlorococcus
(Proc, size= 0.6 um, most abundant autotrophic population), the Synechococcus cyanobacteria (Syn, size= 1 um) and
the picoeukaryotes (Euk, size = 2 um). Fluorescent microspheres (0.95 um beads) were added to the samples in order
to calibrate the system.

Figure 4: Orange vs. red fluorescence plot of unstained, live samples of phytoplankton taken at 95 m
in the Equatorial Pacific. This multiparameter approach allows discrimination between Prochlorococcus (Proc), picoeukaryotes (Euks) and the phycoerythrin-containing Synechococcus (Syn).

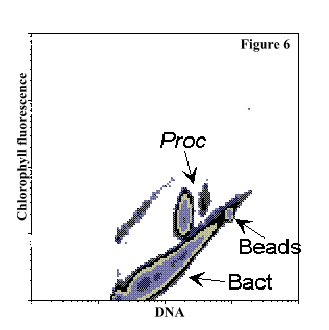
Figure 5: DNA fluorescence (green) vs. chlorophyll fluorescence (red) plot of a natural sample collected in the Equatorial Pacific at 95 m
depth after fixation and staining with the DNA-specific dye SYBR Green I (Molecular Probes, Inc.). With this stain, determining DNA distribution in Prochlorococcus cells (Proc) and enumerating heterotrophic bacteria (Bact) was possible. Heterotrophic
bacteria and Prochlorococcus largely outnumbered (ca. 100X) Synechococcus and picoeukaryotes (not visible on the graph). Fluorescent microspheres were added to the samples in order to calibrate the system.

Figure 6: DNA fluorescence (green) vs chlorophyll fluorescence (red) density plot that corresponds to Figure 5.

Figure 7: Right-angle light scatter (RALS) vs. green fluorescence plot of a natural sample collected in the
Equatorial Pacific at 95 m depth after fixation and staining with the DNA-specific dye SYBR Green I (Molecular Probes, Inc.). Using this method, at least two populations of
heterotrophic bacteria (Bact-I and Bact-II) can be discriminated based on observations previously made by
Li et al (Limnol. Oceanogr. 1995, 40:1485-1495).

Figure 8: RALS vs green fluorescence density plot that corresponds to Figure 7.
 Back to Flow Cytometry and Microbiology Introductory Page
 |
 |
 |
 |