

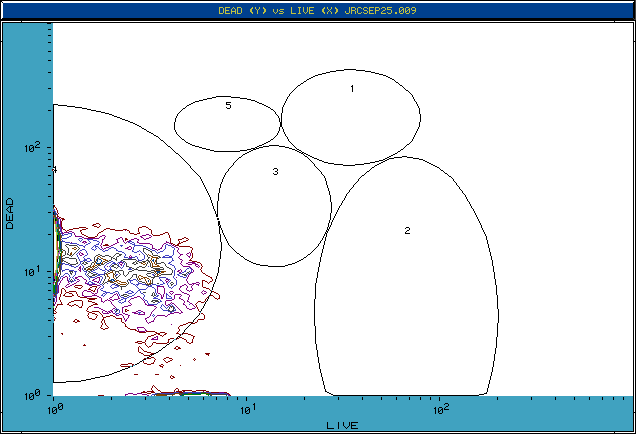
Figure 6: Typical histogram of Escherichia coli treated with 70% ETOH and stained with the BacLight Kit. Region 4 contains non-viable bacteria and is used as a dead control.
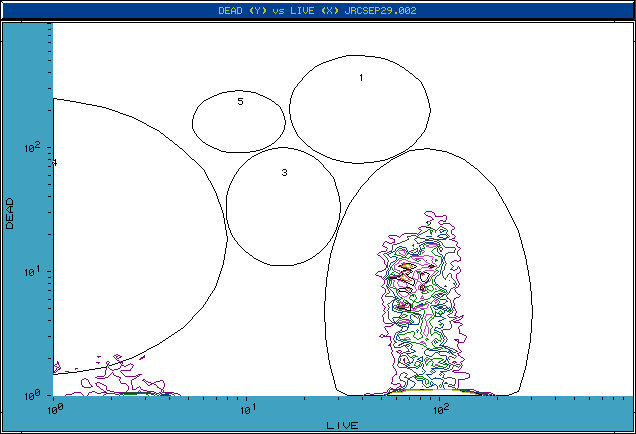
Figure 7: Two color histogram of Escherichia coli incubated at room temperature and stained with BacLight Kit. Cells in region 2 are viable and used as a live control.
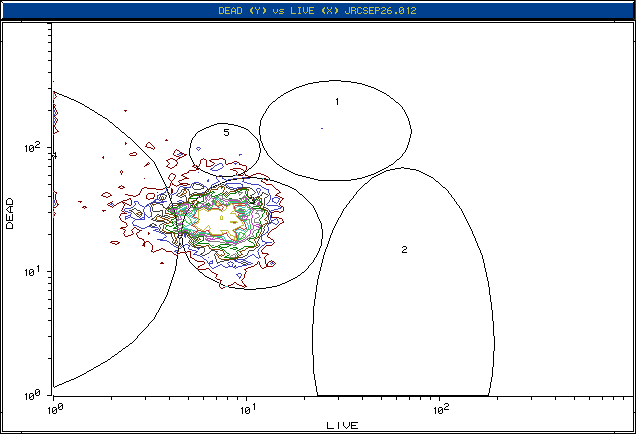
Figure 8: Bivariate contour plot of Escherichia coli heat incubated at 60 degrees Celsius and stained with BacLight Kit. Cells in region 3 are non-viable.
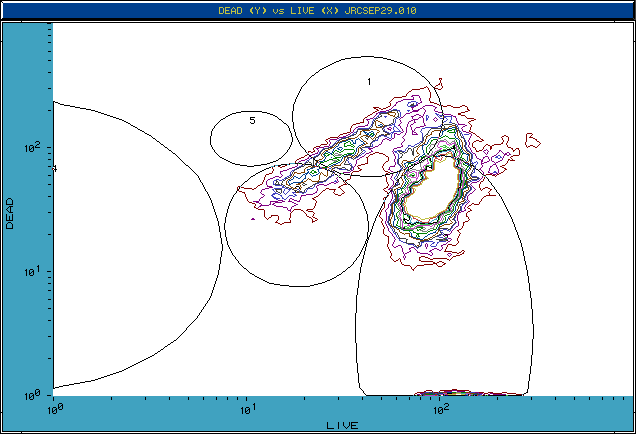
Figure 9: Typical pattern of Escherichia coli treated with Gentamicin (0.5 ug/ml) and stained with BacLight Kit. Cells in region 2 are viable. Regions 1,3,4, and 5 are non-viable.
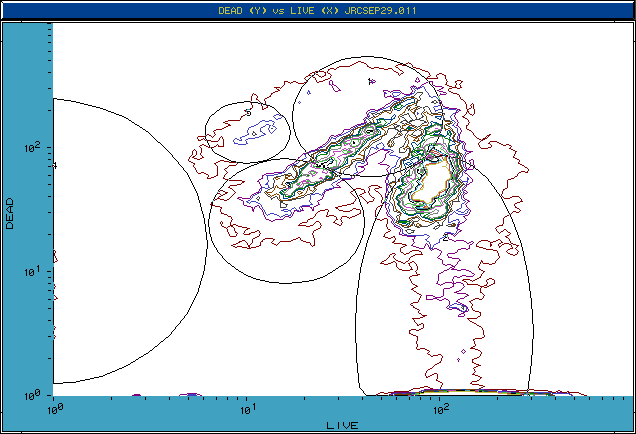
Figure 10: Contour plot of Escherichia coli treated with Gentamicin (16 ug/ml) and stained with the BacLight Kit. Region 2 contains viable cells. Regions 1, 3, 4, and 5 contain non-viable cells. Percentages increased in all non-viable regions as the dosage of Gentamicin was increased and the incubation duration was held constant. As the percentages of non-viable bacteria increased the percent of viable cells in region 2 decreased.


 Back to Flow Cytometry and Microbiology Introductory Page
