
Abstract
Figure Legends
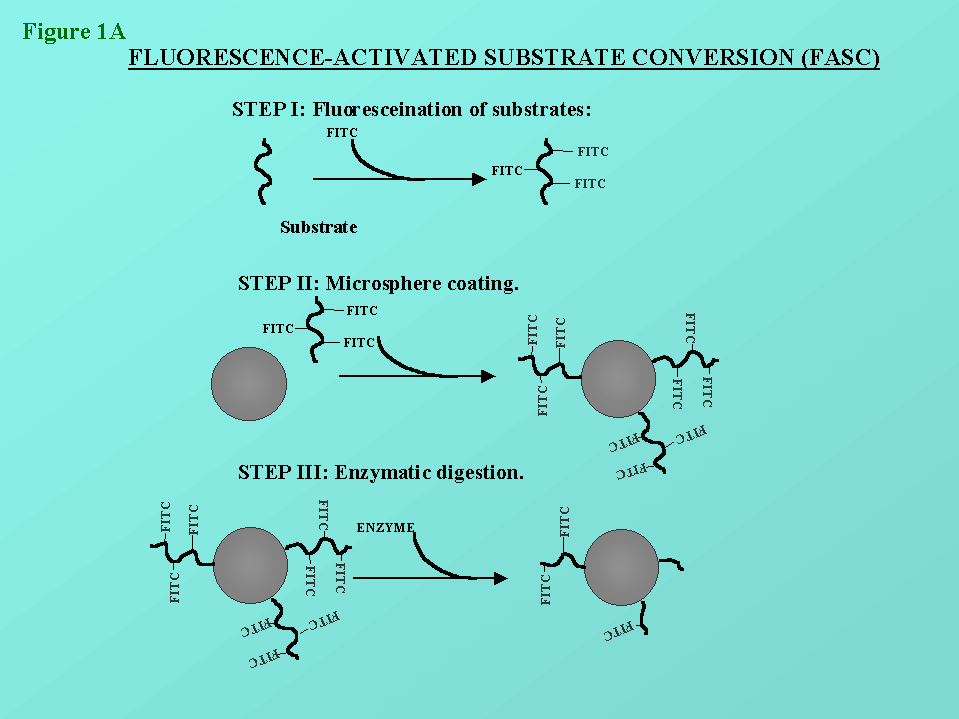
Figure 1: In figures 1a and 1b, the principles of the FASC assay is
depicted. The methodology has been describe previously by us (St-Pierre
et al. (1996), Cytometry 25:374-380).

Figure 2: We used a member of the matrix metalloproteinase, gelatinase B (MMP-9) to construct a dose-response curve for two incubation periods (90min and 18h). The total reaction volume was 100µl. For each concentration (done in triplicates) the residual fluorescence of the beads was evaluated with an Coulter XL-MCL. The fluorescence intensity (in log scale) for the different concentration of gelatinase B after an incubation of 18h is shown.
Figure 3: We evaluated the potential of our technique to determine the net proteolytic activity contained in a biological fluids. We obtained synovial fluids (SF's) from patients suffering from inflammatory joint diseases, with known levels of MMP-9. We could evaluate the titer of the net proteolytic activtities of the SF's by performing a FASC assay on serial dilutions of the samples and the fluorescence evaluated after an incubation of 18h.
Figure 4: We performed a kinetics experiment to determined the minimum time required to obtained a significant response with a biological fluid (ex. SF's). With most SF's a response could be obtained within 30 min.
Figure 5: We compare our assay with the zymography, which is the usual assay for gelatinases. This assay is based of the degradation of the substrate (eg. gelatin) which is copolimerized in the seperating gel of a SDS-PAGE. The sample are run, renatured and the reaction proceed for 18h. Subsequently the gel is stained, and the presence of enzyme, and its levels of activity, is revealed by a clear zone on a blue background. When we compare the SF's with known levels of gelatinase B determined by zymography and the FASC titer for the same sample, we determined that no correlation exist between the presence of the enzyme and the net proteolytic activity.
